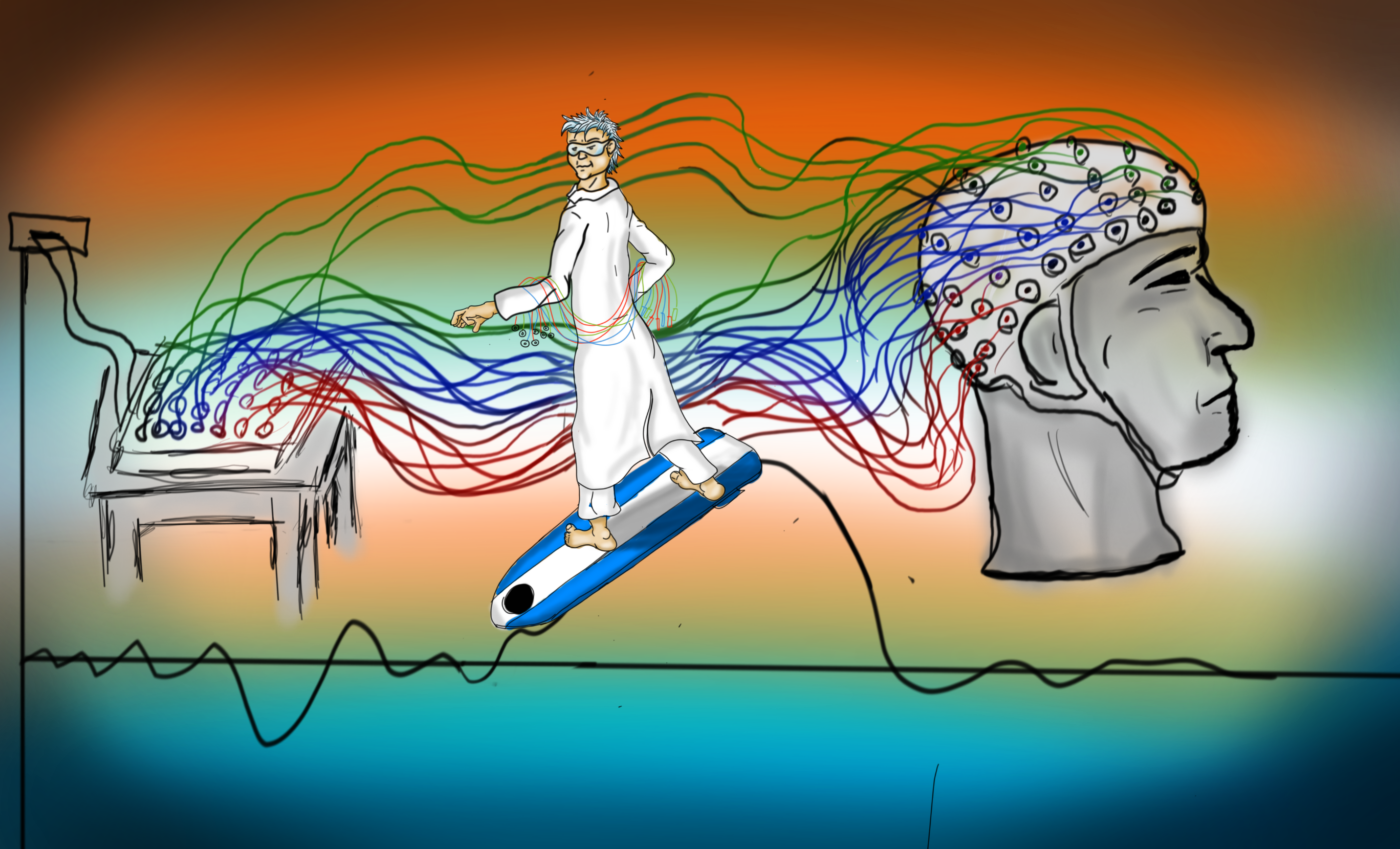


A Cap of Electrodes
100 years ago, German psychiatrist Hans Berger discovered that it is possible to record “brain waves” non-invasively with a technique now known as EEG (1)Millett, D. (2001). Hans Berger: From psychic energy to the EEG. Perspectives in biology and medicine, 44(4), 522-542.. Our technology has obviously advanced within the last 100 years, and yet, some aspects are still the same. Just to get a taste of it, this is how you can imagine participating in an EEG study:
A tight cap is fastened to your head. The experimenter fastens electrodes onto it and moves your hair below the electrodes to the sides with a wooden ‘popsicle’ stick. Then it’s all filled up with a conductive gel. Everybody stares at the screen which shows the electrodes: “We are waiting for the green light for each electrode”. Impedance red, impedance yellow, impedance green. One hour later, we’re finally ready to do the experiment.
Now, the impedance is minimised and conductance maximised. That makes a strong signal. The electrodes are able to measure tiny changes in electric fields, which can be recorded in a computer program. Why is this of interest to a neuroscientist? Neuronal activity is characterised by changes in electric charge within and around the cell body. When several neurons fire together, the accumulated neuronal activity will lead to changes in the electric field. This change is what the EEG electrodes are able to record. A stronger activity is also an indication of the involvement of a specific brain area in whatever is being done at the time.
Brain Waves
The idea is that EEG measures local field potentials, meaning the collective firing of neurons recorded from the scalp beneath the electrode. This delivers different waveforms as an output. The most prevalent are alpha, beta, delta and theta waves, which are characteristic for different activities. The predominance of beta waves (14Hz+) constitutes wakefulness. When falling asleep, the brain switches to slower and slower wave activity. Alpha waves (7-11Hz) indicate that one is tired or closing their eyes. Tuning it a notch down, we land at theta wave activity (4-8Hz) which constitutes classic slow-wave activity. Theta waves are unusual in wakeful adults, but can be measured in prepubertal children. Finally, delta waves are the ‘slowest’ waves at 4Hz or below and can be measured during the final two sleep stages or in infants.
Why Do We Use EEG?
Compared to other non-invasive neuroscientific methods, EEG has the best temporal resolution. That makes it possible to tell that there is something happening within milliseconds. Averaging the EEG signal and connecting its time-course to events delivers the so-called Event-Related Potential (ERP). These two elements i) connecting an event with neural activity and ii) being able to extract a meaningful average from several subjects make EEG a scientifically usable method. Especially when using sufficiently many electrodes (usually 64), the spatial distribution of the scalp recordings can be used to provide a dynamic picture of the distributed brain activity over time. That can be nicely visualised by heat maps (e.g., (2)Overbye, K., Huster, R. J., Walhovd, K. B., Fjell, A. M., & Tamnes, C. K. (2018). Development of the P300 from childhood to adulthood: a multimodal EEG and MRI study. Brain Structure and Function, 223(9), 4337-4349.).
However, there is a specific problem with EEG data called the inverse problem, describing that although activity is measured at a specific electrode, we cannot be sure about the origin of its generation. The signal might be the result of different groups of neurons firing together at different locations leading to final polarity measured with the electrode. It goes so far that cross-hemispheric contamination is possible. Hence, it can be helpful to combine EEG with other techniques or approaches such as neuroimaging (3)Purves, D., Cabeza, R., Huettel, S. A., LaBar, K. S., Platt, M. L., Woldorff, M. G., & Brannon, E. M. (2013). Cognitive neuroscience. Sunderland: Sinauer Associates, Inc.. For example, the cortical development can be observed with the help of neuroimaging, for example by looking at grey matter thickness changes, which are in turn related to EEG signal patterns (4)Overbye, K., Huster, R. J., Walhovd, K. B., Fjell, A. M., & Tamnes, C. K. (2018). Development of the P300 from childhood to adulthood: a multimodal EEG and MRI study. Brain Structure and Function, 223(9), 4337-4349..
What Can We Learn from EEG Studies?
EEG has been widely used in clinical settings to detect arousal levels and sleep stages. EEG is also being used to detect abnormal and strong activity associated with epilepsy (5)Noachtar, S., & Rémi, J. (2009). The role of EEG in epilepsy: a critical review. Epilepsy & Behavior, 15(1), 22-33.. This is due to the specific pattern of synchronised, pulsing activity that epilepsy shows in EEG data. There are also other uses for EEG, like looking at lateralisation in the brain, or even clinical controls for tumors (6)Selvam, V. S., & Devi, S. S. (2015). Analysis of spectral features of EEG signal in brain tumor condition. Measurement science review, 15(4), 219-225..
One really interesting aspect of ERPs is the component known as the P300 – a positive peak at around 300 milliseconds. This is considered the point where actual cognitive evaluation starts happening when discriminating between stimuli, and using this effect has aided our understanding of cognitive development in children (7)Overbye, K., Huster, R. J., Walhovd, K. B., Fjell, A. M., & Tamnes, C. K. (2018). Development of the P300 from childhood to adulthood: a multimodal EEG and MRI study. Brain Structure and Function, 223(9), 4337-4349.! This is only the cognitive aspect. Along with this there is the Mismatch Negativity, also called MMN or N150, a negative peak at around 150 milliseconds. What is interesting about this component is that it happens in the brain regardless of whether the subject is actively paying attention to the task.
This makes the MMN very useful, i.e. when considering the likelihood of comatose patients recovering consciousness – if an EEG response is present, the odds seem clearly better to wake up again (8)Armanfard, N., Komeili, M., Reilly, J. P., & Connolly, J. F. (2018). A machine learning framework for automatic and continuous MMN detection with preliminary results for coma outcome prediction. IEEE journal of biomedical and health informatics, 23(4), 1794-1804..
EEG is not the holy grail of science answering all questions at once. But anyways, which technique can? Simultaneously, EEG has proven itself to be a useful tool to learn more about the underlying mechanisms of behaviour but also about the brain itself. And in cases like patients’ coma outcome prediction EEG can even save lives by convincing to continue therapeutic efforts.
This is the final article in the neuroscience series which has previously covered:
- What Neuroscience Can and Can’t Tell Us
- fMRI = fancy Mega Reliable Imaging?
- Feeling Hormonal Today?
- Debunking Neuroscience Myths
- Modern Electric Brain Stimulation
Thank you for sharing our passion for neuroscience by reading this series! It has been a true pleasure to write about our field and we hope we could interest you in the science of the brain and nervous system!
Referanseliste