


As outlined in a previous article about neuroscience, images of the brain convince people of research articles’ reliability and robustness. Therefore, we have to be extra careful to not think of fMRI as fancy Mega Reliable Imaging. Here is why.
Atoms’ differing magnetic properties and their receptivity to magnetic fields allow researchers to image your brain in a magnet resonance (MR) scanner. When applying the same principle to blood – oxygenated blood has different magnetic properties than deoxygenated blood – we add a functional aspect leading to functional Magnetic Resonance Imaging (fMRI). So, what fMRI actually measures is the blood oxygen level dependent (BOLD) signal, which allows some inference about neuronal activity.
fMRI’s short history
fMRI was developed in the 1980s (1)Ogawa, S., Lee, T. ‐M, Nayak, A. S., & Glynn, P. (1990). Oxygenation‐sensitive contrast in magnetic resonance image of rodent brain at high magnetic fields. Magnetic Resonance in Medicine, 14(1), 68–78. doi: 10.1002/mrm.1910140108. Everything started with task-based fMRI (tb-fMRI), which dominated the field for its first 20 years. The idea is that a specific task performance requires neuronal firing followed by blood-supply, as neurons need new oxygen. An example of tb-fMRI is to show either images or a fixation cross for a while. A stronger BOLD-signal in the occipital cortex during image presentation than during presenting the fixation cross gives indications about visual processing happening in that area.
A more recent and increasingly popular method is resting state fMRI (rs-fMRI) (2)Biswal, B., Zerrin Yetkin, F., Haughton, V. M., & Hyde, J. S. (1995). Functional connectivity in the motor cortex of resting human brain using echo‐planar mri. Magnetic Resonance in Medicine, 34(4), 537–541. doi: 10.1002/mrm.1910340409. rs-fMRI measures the brain’s intrinsic processes by ‘letting people stare at a fixation cross for 10-15 minutes’. Intrinsic processes happen constantly, not only when performing a task. This, and the fact that most functions are widely distributed throughout the cortex, explains rs-fMRI’s popularity. Therefore, neuroimaging has generally moved away from mapping functions to specific locations towards examining the brain’s connectivity.
Problem One: Connecting biology and behaviour
Until here, everything seems fine. But there are a range of problems leading to low quality and credibility of fMRI findings. First, it is not easy to connect biological processes to behaviour and psychological states. Having previous data on behavioural changes connected to a tumour or lesion location can establish a foundation for further inference. When healthy subjects’ fMRI data now match the damaged location when executing a task including the behavioural change, inference with some certainty is possible. Additionally, recently developed modelling approaches such as Dynamic Causal Modelling allow to infer probabilities of causalities in brain network connectivity (3)Zeidman, P., Jafarian, A., Corbin, N., Seghier, M. L., Razi, A., Price, C. J., & Friston, K. J. (2019). A guide to group effective connectivity analysis, part 1: First level analysis with DCM for fMRI. NeuroImage, 200, 174–190. doi: 10.1016/j.neuroimage.2019.06.031 (4)Zeidman, P., Jafarian, A., Seghier, M., Litvak, V., NeuroImage, H. C.-, & 2019, U. (2019). A guide to group effective connectivity analysis, part 2: Second level analysis with PEB. Elsevier, 200, 12–25. Retrieved from https://www.sciencedirect.com/science/article/pii/S1053811919305233.
At the same time, it is important to be aware that inferring mental states from fMRI data alone, the reverse inference fallacy, is the most common fallacy when interpreting neuroimaging data (5)Poldrack, R. A. (2011). Inferring mental states from neuroimaging data: From reverse inference to large-scale decoding. Neuron, 72(5), 692–697. doi: 10.1016/j.neuron.2011.11.001. For example, in a prank fMRI study, researchers concluded that they found the ‘Christmas spirit network’ (6)Hougaard, A., Lindberg, U., Arngrim, N., Larsson, H. B. W., Olesen, J., Amin, F. M., … Haddock, B. T. (2015). Evidence of a christmas spirit network in the brain: Functional MRI study. BMJ: British Medical Journal, 351. doi: 10.1136/bmj.h6266. Experiments are hence only as good as their hypotheses, design, and interpretations (7)Hougaard, A., Lindberg, U., Arngrim, N., Larsson, H. B. W., Olesen, J., Amin, F. M., … Haddock, B. T. (2015). Evidence of a christmas spirit network in the brain: Functional MRI study. BMJ: British Medical Journal, 351. doi: 10.1136/bmj.h6266. Observable BOLD-signal changes after showing Christmas images do not tell whether they occur exclusively for Christmas contents. And this is why it is a prank study. Maybe the findings are really as sober as that: object-associated actions lead to motor cortex activations and looking at images to visual cortex activations. Learning influences these processes.
Problem Two: The secret life of the scanner and how it messes with your results
Unfortunately, it is not as easy as 3, 2, 1, prepare for testing! The road to fMRI-acquisition is marked by many decisions just connected to the scanner! One of the many scanner-setup decisions to make, is the image acquisition speed-accuracy-balance. The faster you scan, the lower the image quality and the less accurate your spatial localisation. Simultaneously, a high temporal resolution is desirable to match the BOLD-signal different experimental stages, for example, image vs fixation cross.
MR scanners differ in their functions and functionalities. Hence, having different scanner types available and variations in how they are set up exacerbate fMRI studies’ replicability. On top of this, the scanner type seems to influence the signal-to-noise-ratio and measurements’ effect sizes in rs-fMRI experiments (8)Friedman, L., Glover, G. H., & The FBIRN Consortium. (2006). Reducing interscanner variability of activation in a multicenter fMRI study: Controlling for signal-to-fluctuation-noise-ratio (SFNR) differences. NeuroImage, 33(2), 471–481. doi: 10.1016/j.neuroimage.2006.07.012. So, difficult decisions which can hamper with the study’s robustness occur already in the planning phase.
Problem Three: Reliability
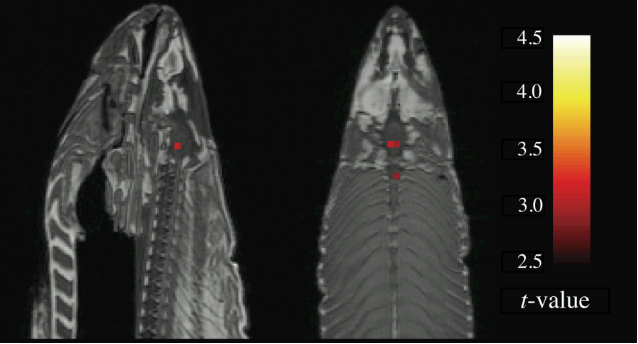
When performing statistical tests, researchers set an acceptable false positive rate described by the alpha level, usually set at 0.05 (1 out of 20). If the alpha level of is not met (here p>0.05), the result is not significant. When performing enough tests it is very likely to discover a statistically significant finding by chance. Some fMRI analyses require thousands of t-tests. Without correcting for multiple comparisons (e.g., by adapting the alpha level) false positives cannot be circumvented. This has been beautifully described by the Ig Nobel Prize-winning, infamous ‘dead salmon study’ which showed that when not correcting for multiple comparisons even a dead salmon appears to have a lively BOLD-signal (9)Bennett, C., Baird, A. A., Miller, M., & Wolford, G. (2009). Neural correlates of interspecies perspective taking in the post-mortem Atlantic Salmon: an argument for multiple comparisons correction. NeuroImage, 47(Suppl 1), 125. doi: 10.1016/s1053-8119(09)71202-9.
While there is strong evidence for poor single-test and test-retest reliability of tb-fMRI (10)Elliott, M. L., Knodt, A. R., Ireland, D., Morris, M. L., Poulton, R., Ramrakha, S., … Hariri, A. R. (2020). What Is the Test-Retest Reliability of Common Task-Functional MRI Measures? New Empirical Evidence and a Meta-Analysis. Psychological Science. doi: 10.1177/0956797620916786, the findings around rs-fMRI are conflicting (11)Noble, S., Scheinost, D., & Constable, R. T. (2019). A decade of test-retest reliability of functional connectivity: A systematic review and meta-analysis. NeuroImage, 203, 116157. doi: 10.1016/j.neuroimage.2019.116157 (12)Zhang, C., Baum, S. A., Adduru, V. R., Biswal, B. B., & Michael, A. M. (2018). Test-retest reliability of dynamic functional connectivity in resting state fMRI. NeuroImage, 183, 907–918. doi: 10.1016/j.neuroimage.2018.08.021. That seems to be explained by the fact that the more dynamic the measured network, the lower its test-retest reliability (13)Zhang, C., Baum, S. A., Adduru, V. R., Biswal, B. B., & Michael, A. M. (2018). Test-retest reliability of dynamic functional connectivity in resting state fMRI. NeuroImage, 183, 907–918. doi: 10.1016/j.neuroimage.2018.08.021. Overall, rs-fMRI-reliability seems to be stronger than tb-fMRI-reliability (14)Holiga, Š., Sambataro, F., Luzy, C., Greig, G., Sarkar, N., Renken, R. J., … Dukart, J. (2018). Test-retest reliability of task-based and resting-state blood oxygen level dependence and cerebral blood flow measures. PLoS ONE, 13(11), e0206583. doi: 10.1371/journal.pone.0206583.
Some explanations for low fMRI reliability are immense intra-subject and inter-subject BOLD-signal variabilities (15)Specht, K. (2020). Current Challenges in Translational and Clinical fMRI and Future Directions. Frontiers in Psychiatry. doi: 10.3389/fpsyt.2019.00924, suboptimal design and pre-processing choices (problem two) (16)Zuo, X. N., & Xing, X. X. (2014). Test-retest reliabilities of resting-state FMRI measurements in human brain functional connectomics: A systems neuroscience perspective. Neuroscience and Biobehavioral Reviews, Vol. 45, pp. 100–118. doi: 10.1016/j.neubiorev.2014.05.009, or good old fashioned human error. Moreover, variations in different research teams’ pre-processing and analysis strategies lead to different results across labs (17)Botvinik-Nezer, R., Holzmeister, F., Camerer, C. F., Dreber, A., Huber, J., Johannesson, M., … Schonberg, T. (2020). Variability in the analysis of a single neuroimaging dataset by many teams. Nature, 582(7810), 84–88. doi: 10.1038/s41586-020-2314-9.
Solutions in sight?
fMRI has an incredible potential to teach us more about the body and mind, and to even inform clinical practice. However, to reach this point, our understanding of BOLD-signal variabilities and methods to measure functional connectivity have to improve. Best practice analysis strategies have to be established and ‘old-and-easy-to-compute standards of analysis’ need to be questioned. For now, we have to live with it: fMRI is complicated, and we cannot yet call it fancy Mega Reliable Imaging.
Referanseliste